I don’t usually participate in Tableau #WorkoutWednesday, but this week the chart we had to reproduce featured my team so I had to give it a go!
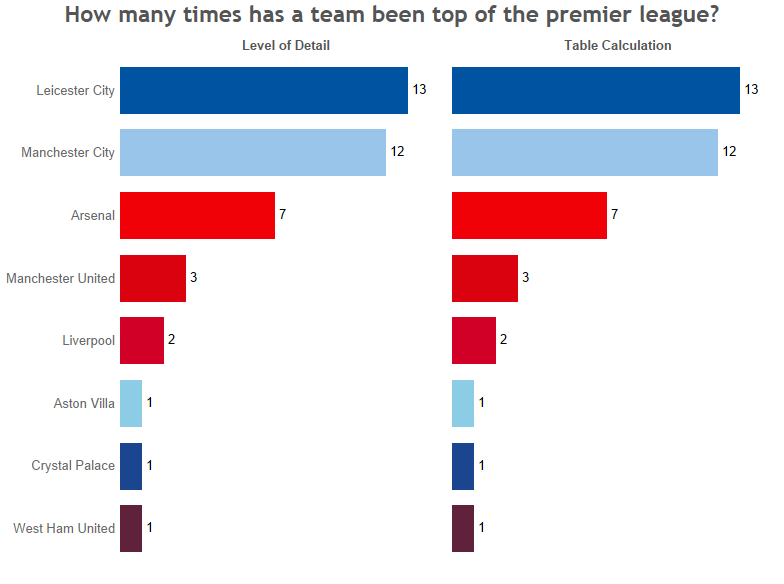
Here is the finished chart, which is also available on Tableau Public:
<th>
  Team
</th>

<th>
  Total points
</th>
<td>
  Arsenal
</td>

<td>
</td>
<td>
  Arsenal
</td>

<td>
  3
</td>
So the challenge is to:
- Look at the total points each team has at the end of a game week
- Rank them to find out which teams are top that week (NB: in actual fact only one team would be top and goal difference would be applied if there was a tie, but the purpose of the challenge wasn’t to get into that. Also it was pre-acknowledged that the data didn’t cover a full season).
- Count up the number of times each team was top
The idea was to do that once using level of detail calculations and again using table calculations. Now to be honest both of these do my head in at times given where I’m at with learning Tableau so it’s a great challenge to try even if the mighty foxes weren’t featured!
Lets start with the table calculations because they are sometimes perceived to be harder.
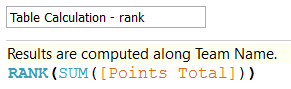
Firstly I calculated the rank for each team based on their total points at the end of each match day, using RANK working along the list of teams. I.e. “give me the rank of each team based on their total points”:
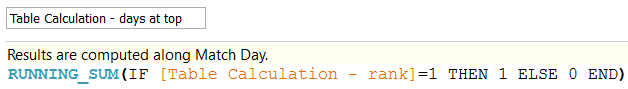
Next I calculated the number of match days each team was at the top using a running sum of :1 when the team was top and 0 when they weren’t, this time along match day. I.e. “give me a running count of the number of times the team has been at the top of the league as we progress through the match days”:
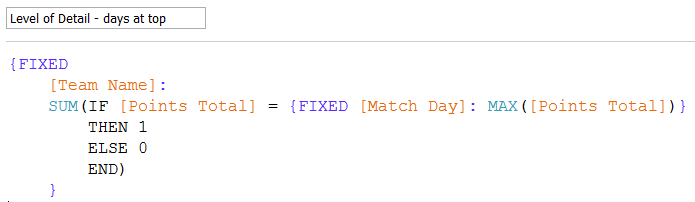
So what about the level of detail version? Well it’s basically doing the same thing, but in a different way of course. I haven’t broken this down into multiple calculations so bear with me. Starting in the middle with the first calculation {FIXED [Match Day]: MAX([Points Total])} I’m saying “tell me what the maximum total points were, regardless of team given that my viz is at the team level of detail, on any match day”* by fixing at the match day level of detail. We can then identify the teams with a points total that matches this max. These are the teams at the top of the table for that match day. We given them a 1 and others a 0. We can then SUM the 1s and 0s up at the Team Name level of detail (i.e. across all match days) to give us a final count:
Another little trick in the workout was to get the axis labels to appear at the top rather than the bottom (in Tableau continuous measures get a bottom axis whereas discrete measures get a category header at the top). The trick here, which I had to Google (leading me back to Andy’s blog of course!) was to duplicate the measures and drag them on to the top of the panel. I then had to clear the axis label and marks at the bottom (you can’t just unclick “show header” as you lose the top labels too).
All in all a fun challenge and some great Tableau calculation practice.