In a recent VizIt Sydney and Tableau User Group presentation, Fantastic Tableau tricks, and how to avoid them, I talked about expander tables and their benefits when working with data in Tableau. In this blog series I’ll cover:
- expander tables in more depth (part 1); and
- use cases they can help with (parts 2+)
But first up…
Why might you need to use an expander table?
When working with data in Tableau it’s not unusual to find that you need to treat a single row of data in more than one way in the same view. A common example is where a row has both an opened date and a closed date, and you need to plot items opened and closed per date. Each item, or row, needs to be counted twice. Another example is where you have multiple measures per row, you need to use more than one on the same view, and a dual axis or the built in Measure Names and Measure Values pills aren’t flexible enough.
An expander table can help you to handle a single row in more than one way.
An example
Let’s use the example of support ticket data:
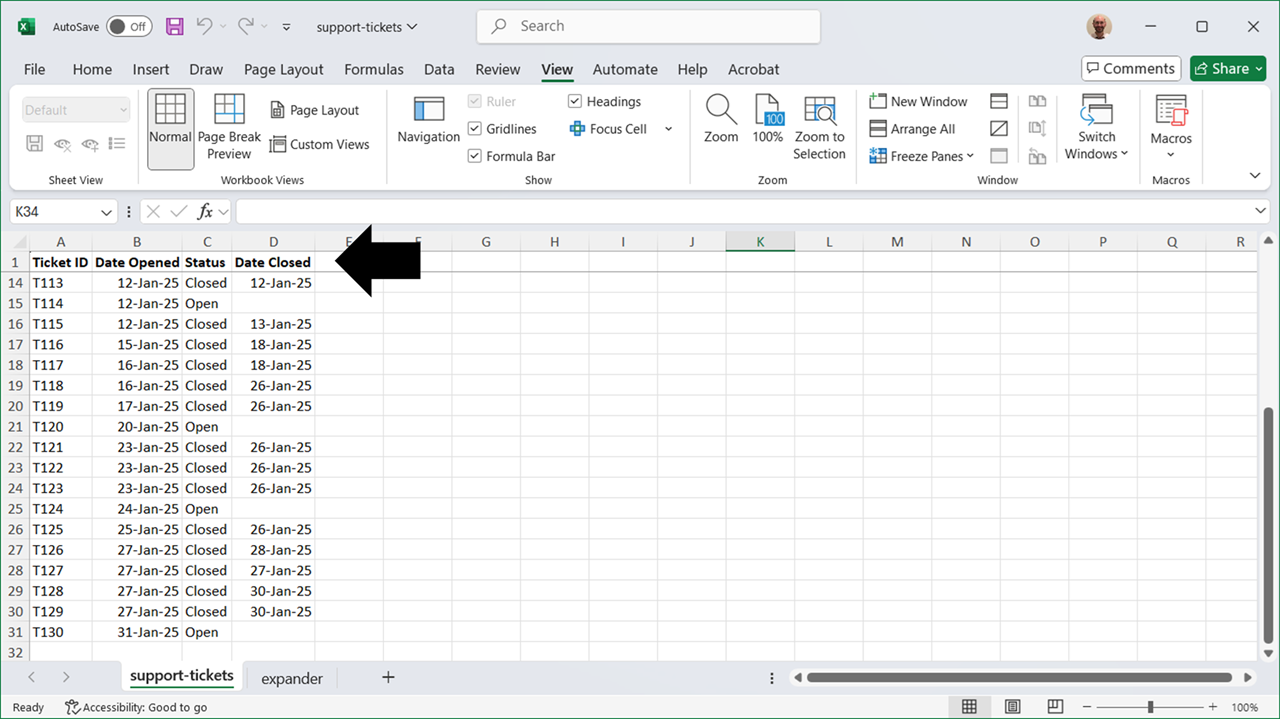
We have a support ticket number and for each of these there is a date opened and a status. When the status is closed we have a date closed.
If we want to plot the number of tickets opened and closed on any given date, we can’t do that easily with the data like this. For each ticket we only have a single row so we can only use the date opened OR the date closed. As the data stands, we can’t use both to count the ticket when it was opened and when it was closed.
You might be used to seeing date scaffold tables to help with this situation, pivoting the data, or possibly using a union like so:
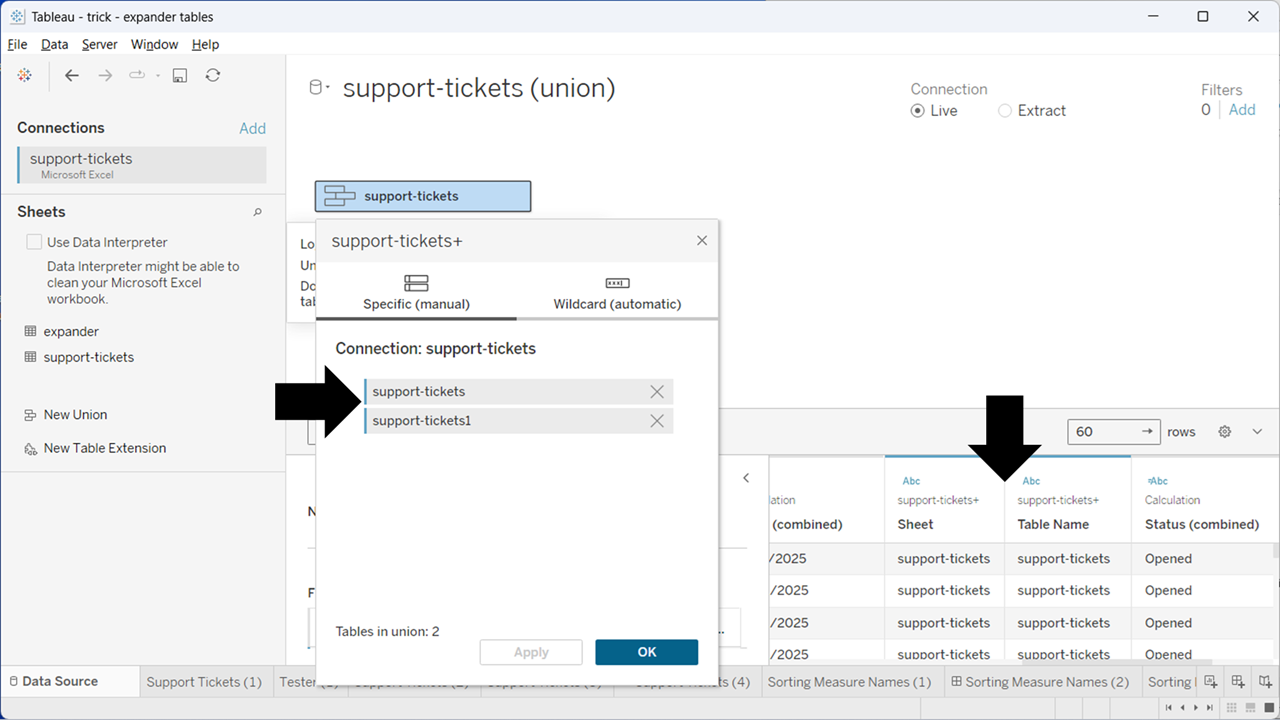
The union (first black arrow) gives you two copies of the data, differentiated by two new fields – Sheet and Table Name (second black arrow).
The problem with these approaches is they often reshape the data in more situations than you want, or in ways that cause other impacts to your charts. For example, with the support ticket data, if we just count the rows in the now union-ed data set we will end up double counting support tickets!
Instead we can use an expander table:
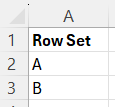
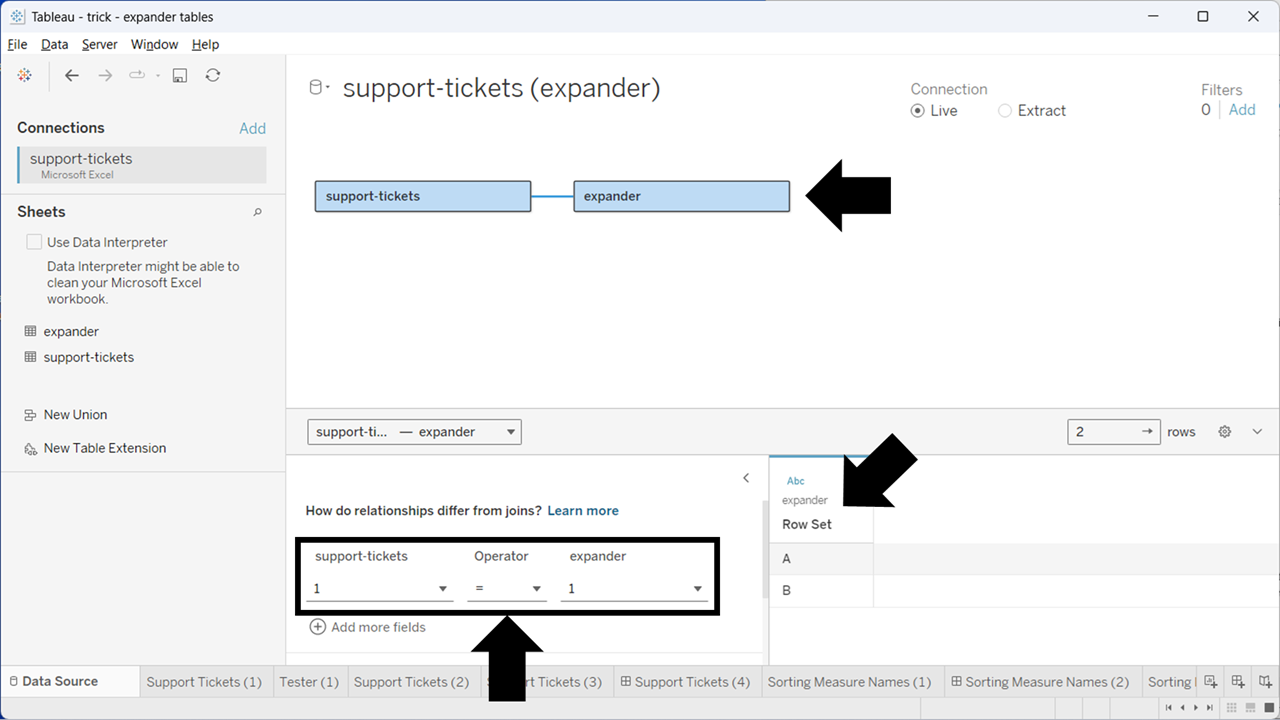
Here I have related an “expander” table onto the support tickets (top black arrow); the expander table has two rows in it (Row Set A and B, highlighted with the diagonal arrow); and the relationship is on a relationship calc of 1=1, which is always true (bottom arrow, note: you choose “relationship calc” in the drop downs here and then enter 1 for each).
This relationship ensures that for every support ticket we can choose to have two rows. But that will only happen when we reference the Row Set from the expander table. In other cases the support tickets data will act as it always has, with no double ups. This ability to only have the extra rows when we choose to is a key advantage over a union or pivot, as it means calcs like the total number of tickets don’t double count by default.
Lets take a look at how we use the expander table when building a view:
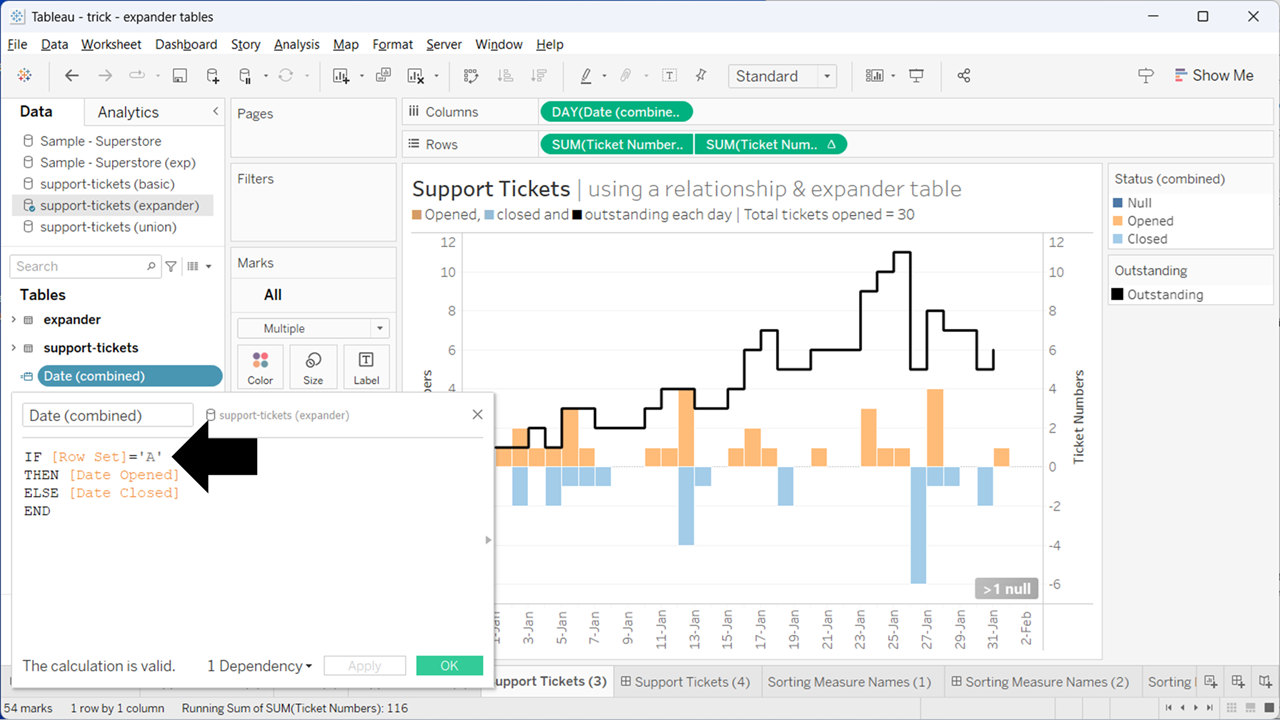
Here I build a combined date. When the Row Set is A, the date will be the date opened. And when the Row Set is B, it will be the date closed. I also create a similar calc for Ticket Numbers: +1 when a ticket was opened (Row Set A), and -1 when a ticket was closed (Row Set B where status is closed):
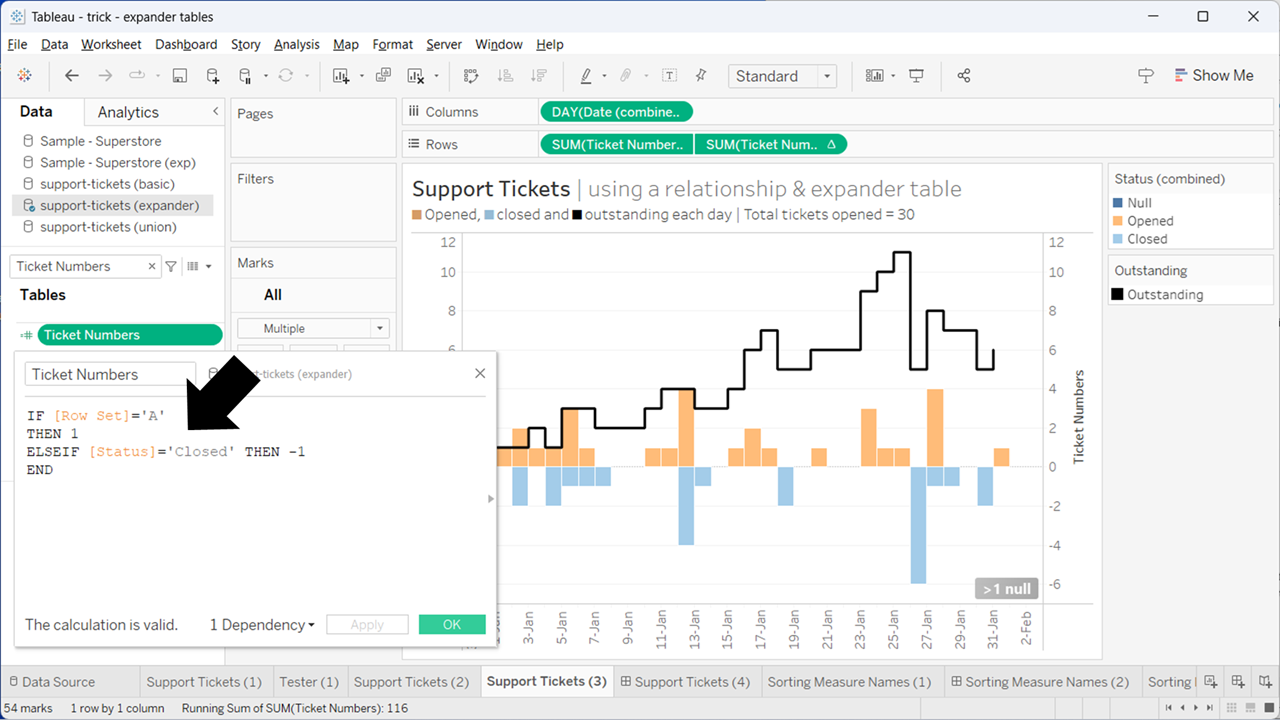
We’re using one set of rows for opened, and the other for closed.
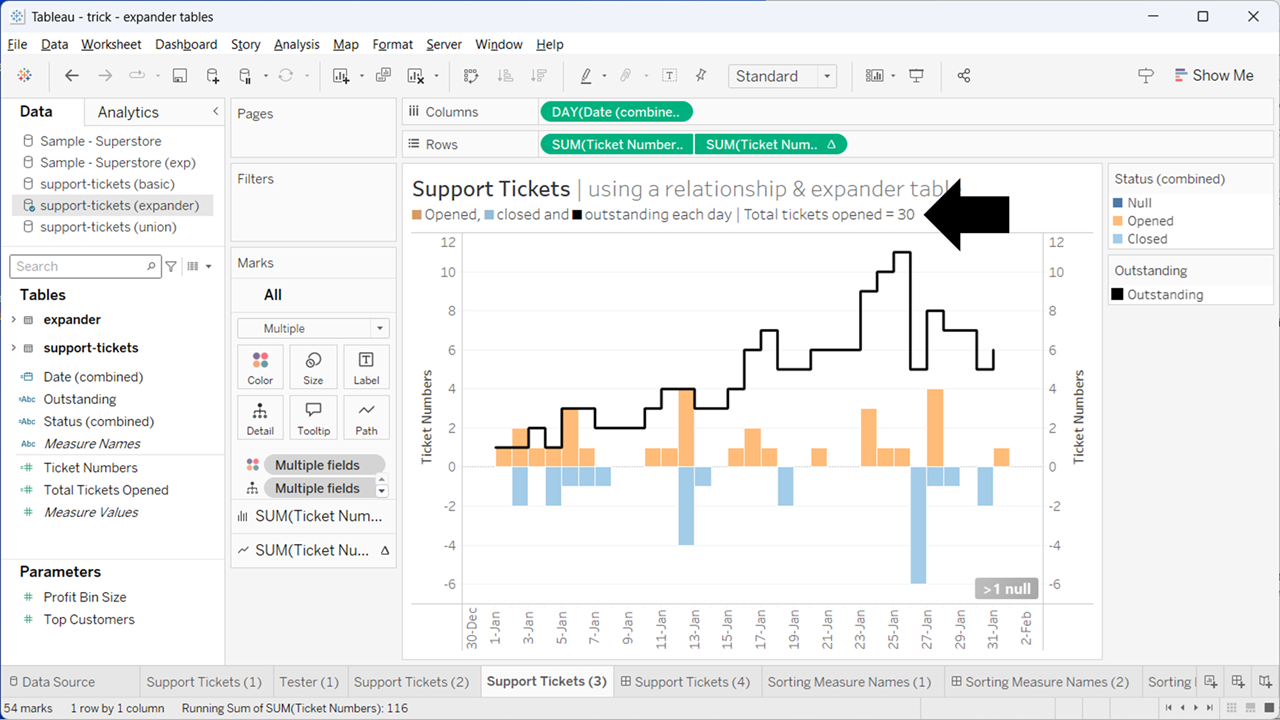
With this we can plot bars for both tickets opened (orange) and tickets closed (light blue). And unlike a union, we can still get the correct total ticket count (black arrow below) without having to adjust that calc … we only get the second set of rows when we needed it, thanks to the way relationships work.
Whilst this is a very simple concept it can be incredibly useful when your data is not quite in the shape you need in Tableau. Cases where you might otherwise turn to Measure Names and Values, a union, pivot, or complex calculations.
What if I can’t add another table / sheet?
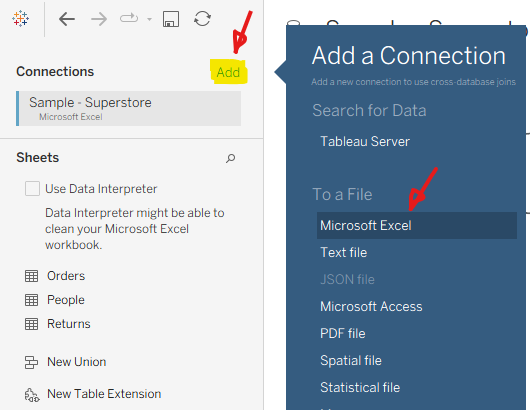
Firstly, if you’re using a database connection you don’t necessarily need an expander table in the same database. You could try adding an extra connection in the Data Source pane, selecting a CSV or Excel and them using that extra connection:
You can also copy a simple text file with a header and X rows and from the “Data” menu “Paste Data as Connection” which will achieve the same thing.
And finally, if you are using a database, you could try adding a Custom SQL where the SQL you enter selects X number of rows from a table that you do have and converts to what you need, e.g. if you have a table “YourTable” that has a Location in it with values North, South, East and West, and you want an expander table with just two rows, you could use this Custom SQL:
NB: This sort of Custom SQL approach does run the risk of reducing performance!
Use cases
In part 2 and part 3 of this blog series I cover six use cases for expander tables:
- Count a single row on multiple dates without using a UNION
- Avoid issues from pivoting your data
- Instead of Measure Names and Measure Values
- Create custom sub totals or grand totals
- Count a category or date in multiple groupings
- Densify your data in other ways
You can also check out the You Tube video at the start of this post (~16m50s to ~21m30s).