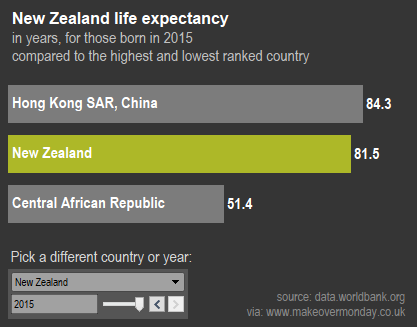
Not so much a makeover for me this week. The original chart was a WHO map of life expectancy data. I’ve just looked at a simple comparison of a country of the viewers choice with the two countries with the highest and lowest life expectancy at birth for a given year:
Want to try different countries or years? Click through to the Tableau public version.
Some of my favourites from the community this week:
- Josh Jackson’s mobile friendly tool tells you how much time do you have left. Gulp! Use it wisely on Makeover Mondays 😉
- S P Vishnu Sekhar did a nice job of one of the popular options this week, highlighting both some horrific events and income disparity.
- Emily Chen’s beautifully clear highlighting of war and famine is a clear favourite! I love the shaded area under the lines, the legend, call outs and overall flow